One of the most exciting questions after starting a blog is about development. How many people visit my website at all, how long do they stay, which posts run well and which ones may not be popular at all. In short: Is my blog successful?
Important key figures also belong in every good media kit. Companies often ask for the usual key performance indicators in order to be able to assess whether a possible cooperation is worthwhile from their point of view.
In the best case you have already set up an analysis tool, e.g. Google Analytics. However, since beginners in particular are sometimes confronted with numbers and statistics like the Ochs vorm Berg, in this article we will give you an overview of the most important key figures, what they mean and what insights you gain from them for your blog analysis.
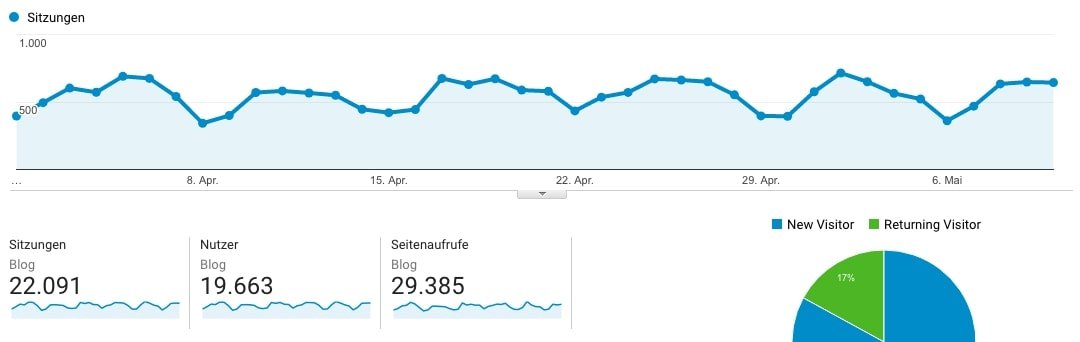
Of course, you first want to know how many visitors your website has. These visitor numbers are called traffic. There are three basic key figures.
At first glance, this number is usually quite high. Because every page of a user that is called up counts here. So if the user clicks on a category page from the start page via a menu item and from there into a post, he has generated three page views. In this case the way is quite clearly structured and unambiguous. However, a high number of page impressions can also indicate that the user finds your website difficult to navigate and often has to click to reach his destination.
The page views should therefore always be considered in combination with other key figures, e.g. the time on site or the bounce rate.
In a nutshell: The number of pages visited by visitors.
When you visit your website, a session is generated. All activities that the user performs within a certain period of time are assigned to this session. If the user is inactive for 30 minutes, the current session will be terminated - this is the default setting. For example, if the user clicks on the page again after 32 minutes of inactivity or returns the next day, a new session is opened. You can reduce the duration of a session in the tracking setting or increase it up to four hours.
In a nutshell: The number of visitors to your website (multiple count of a user).
A user is the classic visitor of your website. If he visits it for the first time he will be rated as a "new user/new visitor". The browser now sets a cookie which assigns an anonymous ID to the user. This in turn ensures that the user is not counted again on a recurring visit to your website. In this case, the user would be transferred to the group of "returning users/visitors".
However, the key figure also contains statistical inaccuracies. Thus it is possible that several persons share a PC - but only one user is counted. Or one person uses several browsers. Here, too, an additional user would be counted each time, even if it is actually the same person. In addition, some Internet users use anonymisation tools that block the setting of cookies. The user would then be counted as a unique visitor each time he or she visits the site. Apart from that, the number of unique visitors shows you quite exactly how many people you reach with your website.
In a nutshell: The number of visitors to your website (no multiple counting of the user).
Now that you know how many visitors you have on your website, you should also know if you like what they find there and how long they stay there.
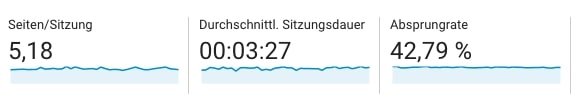
This key figure shows how many pages your users view on average within a session. When analyzing this value, however, you should differentiate between new and returning visitors by clicking on the "All accesses" field and ticking the two user groups. If you generally have a high readership, i.e. a high percentage of returning visitors, the value for pages/sessions will probably be quite low. Why is obvious - these usually read only the most current contributions, since they already know the rest.
Therefore the group of new users is more interesting, because from this you can deduce whether your blog manages to attract the attention of this group. If this value is also very low, you should expand your internal links and e.g. at the end of a post refer to related posts.
In a nutshell: The average number of visited pages within a session.
This is how much time users spend on average on your website. Especially with blogs this value is often quite low. Google's definition of this indicator plays a major role in this. The duration of a session is calculated differently depending on whether an interaction was achieved on the last visited page of a session - i.e. at least one click, pure reading is not counted. So if a user calls up a post, takes about five minutes to read it and then leaves your blog, these five minutes are not recorded in the session duration - because an interaction did not take place according to Google.
In a nutshell: the average duration of a user's website visit.
Users who view only one page on your blog and then "bounce" off it again. The bounce rate tells you how many users do this in total. This figure is relative for a blog and does not necessarily have to be negative as a high value. Possibly users have reached the post directly via a search engine, all questions have been answered and they have left the page again. They bounce, but are still satisfied. Or regular readers only read the most recent article and then left the page again.
In a nutshell: User relationship from those who look at several pages to those who look at only one page and leave the website again.
Now you have a first overview of the general visitor traffic on your website. To find out which articles your users read most often, take a look at the page report. Under "Behaviour - Website content - All pages" you can see the above mentioned key figures page views, time on site and bounce rate for every single post on your site.
Experiment with your posts - different lengths, different headline style, more pictures or the integration of a video. In the Page Report you can then find out over time which type of post and which topics are best received by your readership and use the findings for future posts. But always make sure that some posts are online much longer than others and therefore have more hits, but also more valid data.
Now that you know where your users are and how long they stay there, it is of course also interesting to know where they come from - i.e. where they have become aware of your content. From this you can derive channels that work particularly well for your website or should be pushed even more by you.
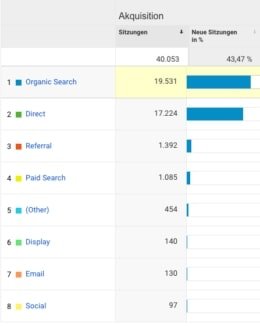
If you click on one of the channels, you will get a corresponding detailed view. The traffic sources are distinguished as follows
If you compare the bounce rate and the conversion rates per channel, you can quickly find out which channel delivers the highest quality users and which channel generates the most revenue. From this you can in turn derive future measures - e.g. that you should operate more SEO or that newsletters are an important sales channel for you.
In a nutshell: Under Acquisition you can see which channels the users used to find your website and therefore which are your strongest traffic suppliers.
Our tip: Just start. Especially when blogging, in many cases the joy of writing is more important than the unconditional urge to succeed. So don't let your supposedly bad key figures spoil your blogger mood. If you go a little deeper into the analysis, take a closer look at the individual posts and channels and derive future strategy measures from them. Then the joy about a rising graph is even higher.